Design Technology Management
By Mark Stefanchuk
This post focuses on managing design technologies from a business perspective. The intent is to provide a definition for design technology management that differentiates it from the day to day upkeep of CAD and introduces approaches to help you plan, execute, and measure the state of your design ecosystem. The topic takes a step back from the usual how-to content found in our blog, but my hope is that it will help you, the CAD manager communicate technology need up the decision tree. – Mark
Have you had a conversation with a business manager that goes something like this?
Manager: “Why haven’t we upgraded? People keep complaining to me that they can’t get their job done because they need the newest version.”
Me: “We can’t just upgrade our CAD platform overnight. CAD engines are really sophisticated. We don’t just draw lines, circles, boxes and text you know. There are resources and standards to consider. And we have projects in flight. Do you know how much legacy data we have? We also have to consider the systems we integrate with? All that code has to be updated. And what about refreshing hardware, we should have upgraded from 32bit OS to 64bit last year.”
I know this makes perfect sense to you and me, but I’m pretty sure the manager was lost after I said “CAD platform”, because this was the response.
Manager: “What are you talking about? That’s too much detail. Give me a picture from the 50,000 ft level.”
What? The first time I got this response I was a little shocked. I just presented a very strong argument for why we can’t do it now. Didn’t I? And why can’t you follow what I’m saying. You’re the boss, after all. Shouldn’t you have some understanding of how our design technology works?
To a technical person, asking us why is a challenge to our abilities. Quick, demonstrate that you are smart! But, when a business leader asks why they want to know about budget, and schedule. They are less interested in the actual work plan, the scope – that’s your job.
The business manager, is attempting to connect the state of the CAD ecosystem with the needs of the overall business. He needs to know that what you’re working on is “aligned” with the business objectives and strategies. Here’s a simple example, your company is an AEC design services firm and has decided that external competition requires that you add BIM to your list of capabilities. This is a strategic business priority that needs to be completed within the next 12 months. If you still think your priority is to implement that file management system you’re probably not aligned.
Design technology management “zooms out” to view the entire design ecosystem – to manage its value and performance within the context of the business. We want to know that we’re working on the right things at the right time, that we’re making smart investments, and that what we do matters.
There are many activities that can be grouped under design technology management. As a CAD manager or coordinator you may even do many of these things like managing vendors, projects, hardware refreshes, annual planning, and so on. Complexity of these activities increases as we add more software titles, hardware platforms, users, and integration points. Smaller organizations can be complex too – working with external partners and clients for example can introduce challenges that make it difficult to get your head around the growing needs of the design team while continuously mapping these to business objectives. How do we get our “head” around the complexity? The following cycle works reasonably well.
This framework groups together design technology management into five stages. I have labeled the stages of the cycle as plan, align, map, analyze, and measure. The cycle only ends with decommission of the technology otherwise each stage is revisited periodically. Let’s look at each stage individually.
Plan: This is a preliminary stage where you try to capture technology needs from the design team’s perspective. You’re trying to identify all gaps in resources but typically the focus is on recurring events like upgrades and hardware updates. There are at least three components to this stage.
1) Meet with the design teams to capture what they think their needs are. This isn’t an order taking process. You want them to share their wish list, but it must be accompanied by how they think it will improve their work flow and how they might measure the success or failure of the request. This measurable benefit is important because it will allow you to determine if fulfilling the request was effective and if the investment should continue into the next design technology management analysis cycle.
2) Categorize into new technology asks versus recurring annual needs like upgrades and refreshes. These are often prioritized and funded separately.
3) Budget – Create a preliminary budget for these needs. This gives you a starting point for scheduling and prioritization. If you have financial partners or managers to consult then a first meeting is in order because you want to find out what your real budget constraints are going to be.
The only way to capture this information is to ask. You have to go out and meet with the teams that do the work to find out what they are thinking. There will be more requests than you can handle in a given budget year, so make it clear that this is the first step in the planning process. In the next stage of the design technology management analysis cycle they are going to help you prioritize.
Align: A health assessment of high level activities for each of your design practices will help you identify needs within the context of the business. With a ranked assessment you can prioritize investments and with this knowledge you will be able to build a roadmap for technology needs that are aligned with real business goals. The prize for us is to get a roadmap that guides our daily work effort, but be aware that this isn’t a static map. Assessment of priorities must be addressed whenever the business strategies change. There are basically three exercises that I’ve found help get us from what we think we want to do, to what we should do – identify the practice workflow, rank high level work processes, prioritize and rationalize needs.
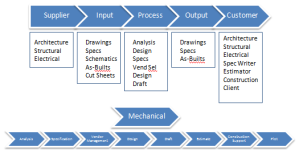
1) Identify (practice steps): Start with your core design disciplines -survey, structural, and so on. Next break these down into key steps – analyze, design, draft, plot, etc. With this you should be able to build a good high level understanding of the process for each of your core design competencies – from upstream interactions to downstream deliverables. Do a Google search on the six sigma term SIPOC. This tool will help you to build a picture of the core design competency. It is especially useful if you have limited experience with the discipline. (First level sub processes are enough for this exercise.)
2) Rank: Once you have an understanding of the practice you can evaluate its components. Having a measure of the value and performance will give you a way to compare needs – we’ll get to that in step 3. First you want to determine the business value and rank based on strategic influence, the impact on your P&L, and how critical the capability is to your business. Use a scale from 1-5 to rank each.
In similar fashion you want to understand the performance of the capability. You can break this down in many ways to get a strong picture of performance but as a minimum we want to know, a) do we have the right people with the rights skills and training? b) does the process work and produce the product we want with the right quality and cost? c) do we have the right technology, the best technology, are we on par with the competition or are we less efficient than we could be? Building your list of questions to address the health of the people, process, and technology will tell you where your efforts need to be applied. Rank these on the same 1-5 scale for each process step identified. Finally, for each practice step calculate the average score for value and the average score for performance.
You can’t really assess the practice on your own. You will need to connect with both design leaders and business executives to get their assessment of value and performance. In some cases it will be obvious, in others you’ll discover things about your design practice that will surprise you.
3) Prioritize: In step 2 we ranked all of our design practice steps and assigned a number to indicate the strength of its performance and value. These dimensions, performance and value will allow us to identify high priority opportunities. If the practice step has a high value but is performing poorly then it has a higher priority for action than if it is working well, but has a low value. From step 2 you will also be able to find out where you need to apply attention – does the process need fixing, do we need training, or a technology update.
If you plot these results in a 2×2 framework you will see immediately where to apply your efforts and you will be able to compare across disciplines (across capabilities).
In the 2×2’s above the color dots represent a design practice step and the relative priority of each. In this exercise you also want to highlight the real opportunity – is a technology improvement needed or is there an issue with skills and experience. If the issue is with technology then there will be some correlation to a specific technology or group of technologies – we need to upgrade because we are four versions behind what our completion is using. So the actionable priority becomes an upgrade.
This is your first opportunity to go back to the wish list and show your clients what they should do next (and why they need to do it). It’s also your chance to demonstrate to your boss that you know what’s important (yes – from that 50,000 ft level).
Map: A roadmap will tell you what to do and in what order. It’s a guide for communication and project planning. You can now tell your boss when that upgrade is going to happen and why it’s not happening now – Your answer to his question may sound more like this, “The upgrade will happen in October. The BIM deployment has to happen first so that we can meet our business objective of BIM compliance by the end of the year.” Simple, sweet, your manager will get that. There’s nothing terribly complicated about creating a roadmap. It’s just project planning – scope, schedule, and budget at the highest level. Work this out for your priority items and present it on a timeline.
Analyze: Vendors still talk to me about getting a better return on my CAD investment, or improving efficiency, productivity and/or quality. These things sound great, but do they mean anything? Let’s say that you assess your design practice and discover that the CAD engine you use is industry standard, but you’ve found that a significant number of your employees lack an understanding of standard practices unique to your organization. Your vendor has told you that they can improve the return on your CAD investment if you purchase their annual training plan that will give all of your employee’s access to their on-line fundamentals training. Will it improve your ROI? By how much? You don’t have to do any additional analysis to figure out that it’s not a good investment for you because it doesn’t address your priority. You need training, but not CAD fundamentals. You need customized standards training. Now, if the vendor had said we can develop and deliver a “customized standards training package for your organization” then you may in fact have an opportunity to add value. Let’s take a closer look.
There are two analysis tools that I’ve found helpful, 1) Net Present Value (NPV), and 2) Total Cost of Ownership (TCO). You can find good information on-line for both of these (and I’m no financials wizard), so I’ll focus on when to use them versus how to use them.
1) NPV – The idea behind an NPV analysis is to demonstrate that an investment will add value to the organization. That means that there has to be some type of hard savings or revenue gains realized by making the investment. In our training example above, our vendor has provided a proposal that will cost $275k. It’s a onetime project cost and will cover content development with both on-line learning modules and in classroom training for up to 150 users. You estimate that the improved quality will reduce errors and omissions by 0.025% and the increased productivity will eliminate a contractor head count. Your assumption is that your will save $70k per year for the next five years. Is this a good investment? It looks like it right? 70kx5-275k=75k. Great! Not so fast. What if I told you that your money costs 9%? An NPV analysis will tell you that this is not an appropriate investment for your business. It will show you that over a 5 year period this investment has a negative value when your money costs you 9%. What if the same training package only cost $250k. In this case NPV shows that the training will be a good use of the company’s money – tell your vendor you want a discount.
2) TCO – total cost of ownership attempts to capture the cost of owning a technology over its entire life span. TCO includes licensing, development, systems management, service fees, maintenance, support, training, decommission and disposal, refresh, and so on. TCO is an ideal tool for comparing technology solutions. Even when sticker price for technology is different between vendors you may find similar life time cost, or very different life time costs. You may find very little difference between the TCO of MicroStation and the TCO of AutoCAD. They are desktop applications that do essentially the same thing. If on the other hand you are looking to implement an enterprise PLM solution the TCO of competing solutions can be very different (and quite high) which is typical of most enterprise solutions.
Financial analysis is a guide to help you compare investment opportunities. All organizations vary in their use and application of this type of analysis. Larger projects are more likely to get the scrutiny of financial analysis while managers, for many reasons good and bad, will take short cuts on smaller projects. If you have to implement a technology to remain relevant then you have to do it – additional financial analysis isn’t really going to tell you anything new.
Measure: The next stage in the framework is to review assumptions and benefits. You’ve put in place projects, or purchased technology to address priorities. Now you want to know if your efforts are doing what you expect. For example, if priorities are strategic you want to know simply whether or not you met your implementation goal.
Returning to our simple BIM example, the design teams are now BIM capable and we have 2 BIM projects in production with plans for 6 next year. If that was your goal then you are trending in the right direction. You may have also performed a long term financial analysis and will want to re-visit your assumptions to make sure they are still valid. If they are then you’re trending in the right direction if not you will need to understand if continued investment is warranted.
A measurement plan, such as an initiative versus outcome matrix can facilitate review sessions and keep you honest. With just a handful of high level initiatives you can probably just get by with your roadmap. Teams with hundreds of initiatives likely adopt more complex systems, but a simple spreadsheet with your key initiatives and expected outcomes can work well too.
Developing a working knowledge of design technology management in the context of your organization will make you both technically savvy and business savvy. That’s a strong combination that will keep you relevant and working for a long time. And hey, you’re less likely to get caught answering questions with too much detail.
About Mark Stefanchuk: Mark is a senior consultant with CAD Management Resources, Inc. He divides his time between developing innovative custom software solutions and helping clients navigate complex design automation environments. If you would like to find out how he can assist you with your design technology ecosystem he can be reached by contacting us at info@cadmanage.com.
“I need to get a surface from Civil 3D for InRoads, I’ll just export a LandXML file, right?”
by Seth Cohen, CADmanage.com
So, you are asked to give a surface that you created in Civil 3D to a company that uses Bentley InRoads. You assume, because you have heard it from everyone, just export it to LandXML and all will be good. Well, that works……….sometimes. Let’s look at some reasons why this is not always %100 correct.
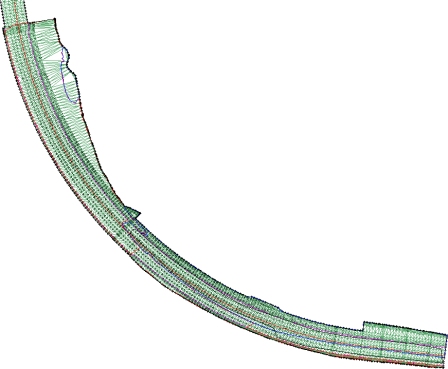
In the example below, my surface in Civil 3D looks perfect.
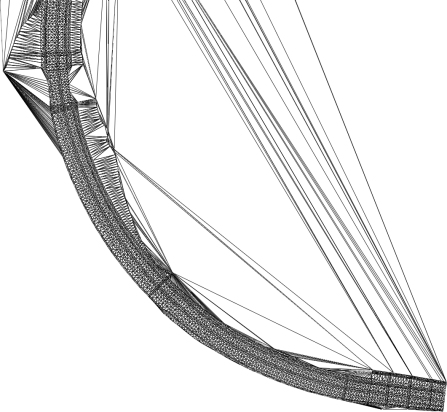
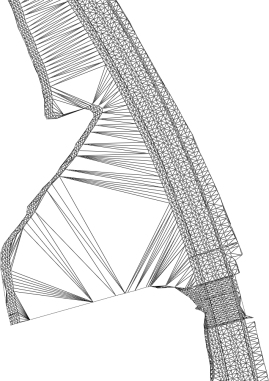
However, when the surface is translated in InRoads from the LandXML file, this is what it looks like.
So, as you can see, sometimes it is not a one-to-one translation. In this example the reason the surface did not come in properly is that in Civil 3D, the triangles were deleted and a surface boundary was not used to “bound” the surface. The solution in this example is to extract the boundary of the surface in Civil 3D, and bring it into the surface as an Outer Boundary. When the surface is translated into InRoads, the surface boundary will come in as a breakline, allowing the InRoads user to use the boundary to create an Exterior Boundary (as it’s called in InRoads).
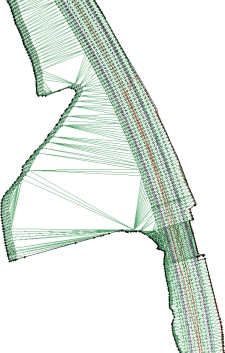
Another issue is shown below in the following images:
As you can see, the triangles don’t match up, and the InRoads user is not going to know that the triangles are incorrect. Now sometimes this is more of an issue in each software package and the different algorithms used to triangulate the surface, and the InRoads user will have to Change Triangle Edges (Swap Edge in Civil 3D) to match the correct triangulation. However, with the correct data provided to the InRoads user, the surface can match the Civil 3D version.
So, what can you do to ensure that an accurate surface will be reproduced in InRoads? Here are some tips that will help ensure a more accurate model representation.
- Add an exterior boundary to the surface (as mentioned in the first section)
- Make sure the surface is using a style that shows triangles, and export the DWG to either a MicroStation DGN file or AutoCAD graphics. This will allow the InRoads user to see how the surface should look (triangulation-wise). Additionally, the InRoads user will have whatever 3D graphics they will need to make the surface work correctly.
- Verify that the necessary settings are defined in the LandXML Settings dialog box. This dialog box is found in the Settings tab > right-click on the drawing name > Select Edit LandXML Settings.
“Now you know, and knowing is half the battle.”…………G.I. Joe


